CHECK issues-measurement-reporting-whs-performance-docx on desktop. REFER to 3.2.2 LTI(FR) is not a measure of safety section.
If you’re in the safety space, you should be very familiar with the term LTIFR (lost time injury frequency rates) which is also accompanied by LTI (lost-time injury). However, if you’re new to the safety world, both terms are considered important when reviewing the safety performance of your workplace.
For a quick catch-up, here are the definitions:
LTIFR (Lost-Time Injury Frequency Rates) – The number of lost-time injuries occurring in a workplace per 1 million hours worked.
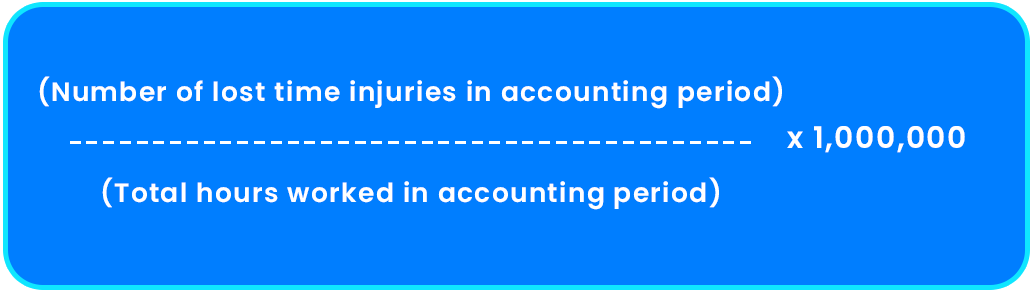
LTI Frequency Rate Calculation
The LTIFR is calculated by the number of lost-time injuries in account period divided by the total hours worked in an accounting period multiplied by 1 million hours worked. As the number of lost-time injuries per hour worked is low, a multiplier of 1 million is typically used to serve as a benchmark indicator.
Here’s an example:
In 2019, a major logistics company had four people injured at work. Two of the four were off work for 3 days while the other two were off for two weeks. The company employs 1,500 people and the total hours worked for this period was 3,159,000 hours. To calculate the LTIFR for this business, it’s recorded as:
(4/3,159,000) x 1,000,000 = 1.27
The industry benchmark for Transport and Support Services is 10.7 so in this case, the company is performing better than their peers for this metric. The lower the LTIFR for your business, the better, and comparing it to your industry benchmark can serve as a suitable comparison. For all industry benchmarks, you can find a calculator supplied by Safe Work Australia here.
Why is this important for my business?
While LTIFR is a core safety metric, it shouldn’t be analysed by your team on its own and instead should serve as a component in a broader criteria of lagging and leading indicators. As LTIFR is a lagging indicator it measures past performance which cannot be influenced or changed, utilising leading indicators helps your workplace be reactive and to enforce positive change going forward. While it is easy to calculate and to use as a comparison method to industry peers, LTIFR does not take into consideration how many days were off by the injured staff or the severity of the injury and some may argue that this results in a superficial metric.
Your business should report on a variety of lagging and leading indicators to improve the safety of your workplace and team. This allows your workplace and management team to have a clearer perception of the current state of safety in your workplace and if there is an area that needs to be addressed now before future complications occur.
For more information on lagging and leading indicators, read this.
What’s the easiest way of tracking LTIFR?
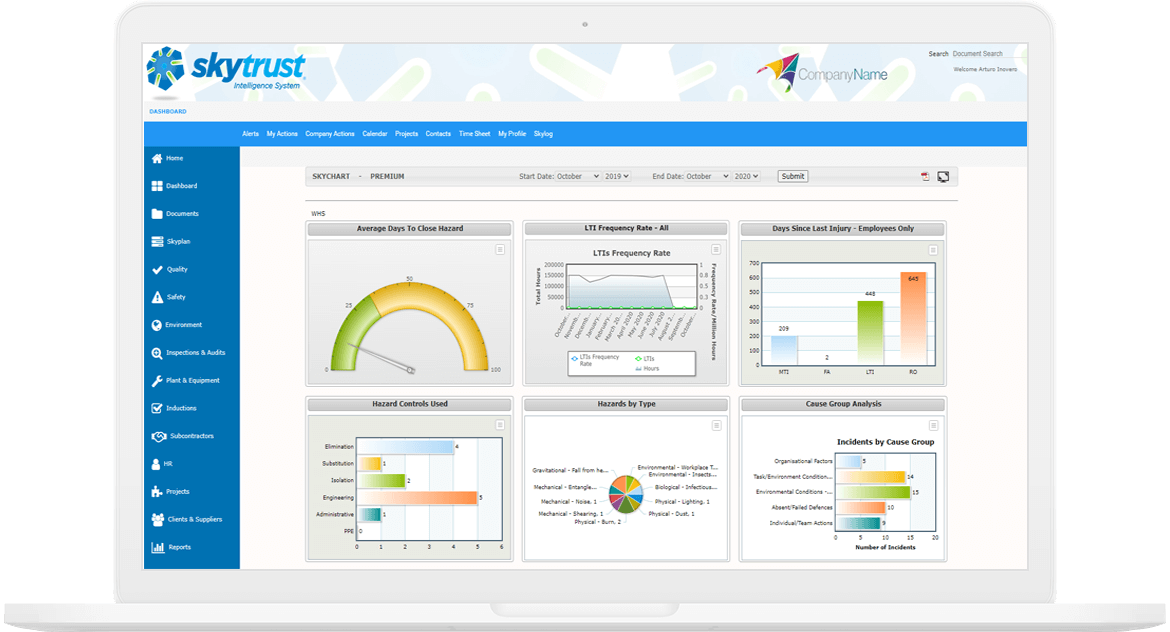
Wouldn’t it be great if you could automatically keep track of safety metrics such as LTIFR without having to report through spreadsheets. Well, with Skytrust this is a reality. The Skytrust Dashboard populates your data in an easy to read graph for over 50 reporting metrics including LTIFR, Average Days to Close Hazard and Incident Root Cause to name a few. These can be easily exported into a report for you and your management team to make data-driven decisions.
Utilising your business’ LTIFR is just one component of a broader safety management program. Your business needs a data-driven platform that allows you to collate this data into easily-readable graphs to allow for full transparency and ultimately ensure that your workers get home safely.
To find out why Skytrust is trusted by industry leaders Toyota Material Handling & United Petroleum to simplify their WHS requirements