With an abundance of metrics to track and analyse WHS hazards in the OHS audit safety & compliance space, the question can soon arise of “Why are we tracking this and what is it actually telling us?”. Leading businesses with a positive safety culture understand the metrics they are tracking but also implement the suitable corrective actions to combat the troubling data. These businesses utilise a combination of lagging and leading indicators to provide for a comprehensive workplace safety program. Without a user-friendly & proactive system in place, tracking and analysing lagging and leading indicators in an easy to understand format such as graphs can be an almost impossible task. So what exactly are WHS monitor & OHS management system lagging and leading indicators and what is the easiest way to track them?

What are lagging indicators?
Lagging Indicators by definition are key performance indicators (KPIs) that use past results or statistics to record performance. They are reactive by nature and as a result, only take in consideration incidents or events that have occurred in the past. Some of the common lagging indicators include Incident Rates, Lost-Time Injury Frequency Rate (LITFR) & Worker’s Compensation Claims. These types of indicators are known for presenting limitations if used in isolation.
These include:
- Fail to identify the root cause of particular incidents or events which makes it difficult to introduce prevention methods
- Provide insights where it may be too late to do anything about it (due to its reactionary nature)
- A potential to promote complacency as a workplace may exhibit a low injury rate which causes other pressing performance metrics to become more of a priority
Due to the reactionary nature of lagging indicators, a common analogy used is driving while looking in the rear-view mirror. In the same sense of a business, when driving certain safety measures forward it would be extremely wise to focus more on what’s in front through leading indicators as they can provide predictive insight into what may unfold. This allows your business to avoid compliance breaches and allows for prevention measures to be introduced before a fatal incident occurs rather than solely focusing on past events that cannot be changed.
For a complete and well-rounded assessment into a business’ work health and safety performance, a combination of relevant lagging indicators and leading indicators should be used.
What are leading indicators?
Leading indicators are proactive by nature and can be observed and recorded prior to an injury or a negative outcome. Conversely to lagging indicators, leading indicators can effectively measure the efforts of prevention measures. The Campbell Institute at the National Safety Council has defined leading indicators as “Proactive, preventative and predictive measures that monitor and provide current information about the effective performance, activities, and process of an WHS/EHS management system that can drive the identification and elimination or control of risks in the workplace that can cause incidents and injuries”.
To put it simply, “Leading indicators dictate the action plan while lagging indicators measure the effectiveness of that plan in achieving the desired workplace safety outcomes”.
The Campbell Institute have categorised leading indicators into Operation-Based, Systems-Based and Behaviour-Based and this can be an effective starting point for implementing core leading indicators into your safety program. See the graphic below for examples of each:

(For the full overview of Campbell Institute’s Guide to Leading Indicators, click here)
It must be noted that while leading indicators have a proactive approach, they also exhibit some limitations if not used in the correct application. Open Alberta outlines some of these limitations which include:
- Look for leading indicators that serve to identify trends instead of providing instantaneous, one-off measures
- If leading indicators are a new addition to your workplace health & safety program, focus on a few key measures as introducing too many can detract from the focus or value
- Be wary of the logistics involved in collecting the information required to formulate leading indicators. If the costs are too high or it’s too time-consuming, it’s less likely to happen. Thankfully, a system like Skytrust EHS software for manufacturing can help automate this process so graphs are populated and updated as the relevant data is recorded.
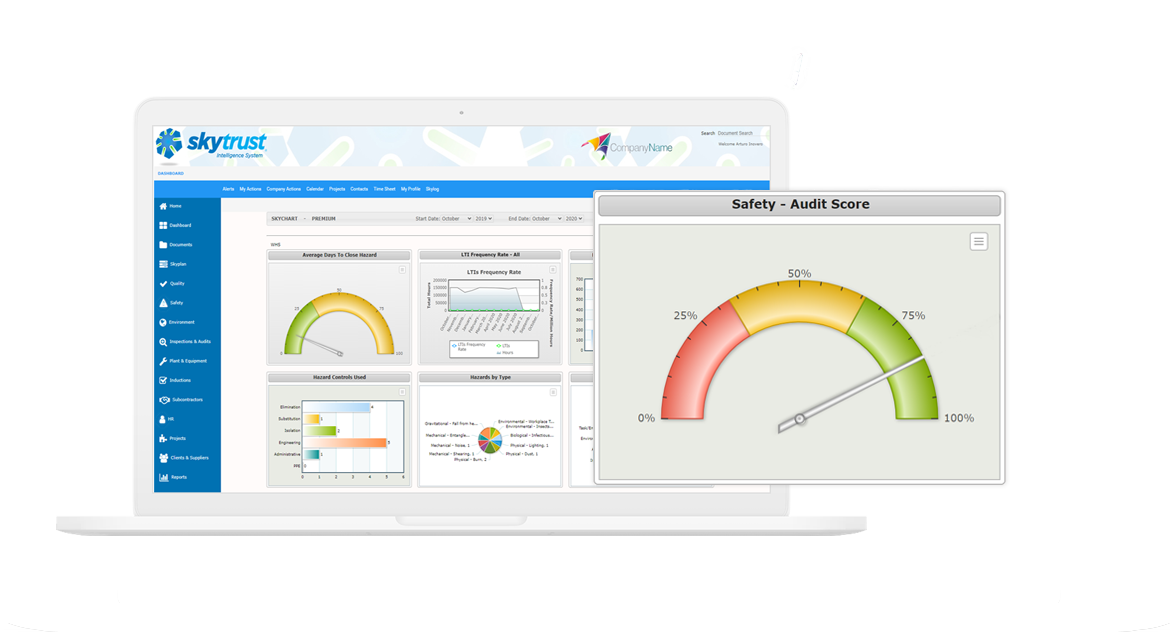
Skytrust makes tracking lagging and leading indicators for your business EASY
Skytrust WHS platform & OHS management system provides for an automated way of tracking over 40 leading and lagging KPIs to help improve the management of your workplace safety program. Easy to read graphs allow for a clear overview of your business’ operations and reports can be extracted with a click of a button to have it ready for the next management meeting. Having the relevant metrics and data in front of your face daily can ensure your workplace is staying compliant and is constantly looking at ways to improve your safety & wellbeing program. You can’t improve what you can’t see and with Skytrust problematic issues are at the forefront so you can make well informed and data-driven decisions.